| Fig. 6-1 |
ENVISAT launch (photo: ESA) |

|
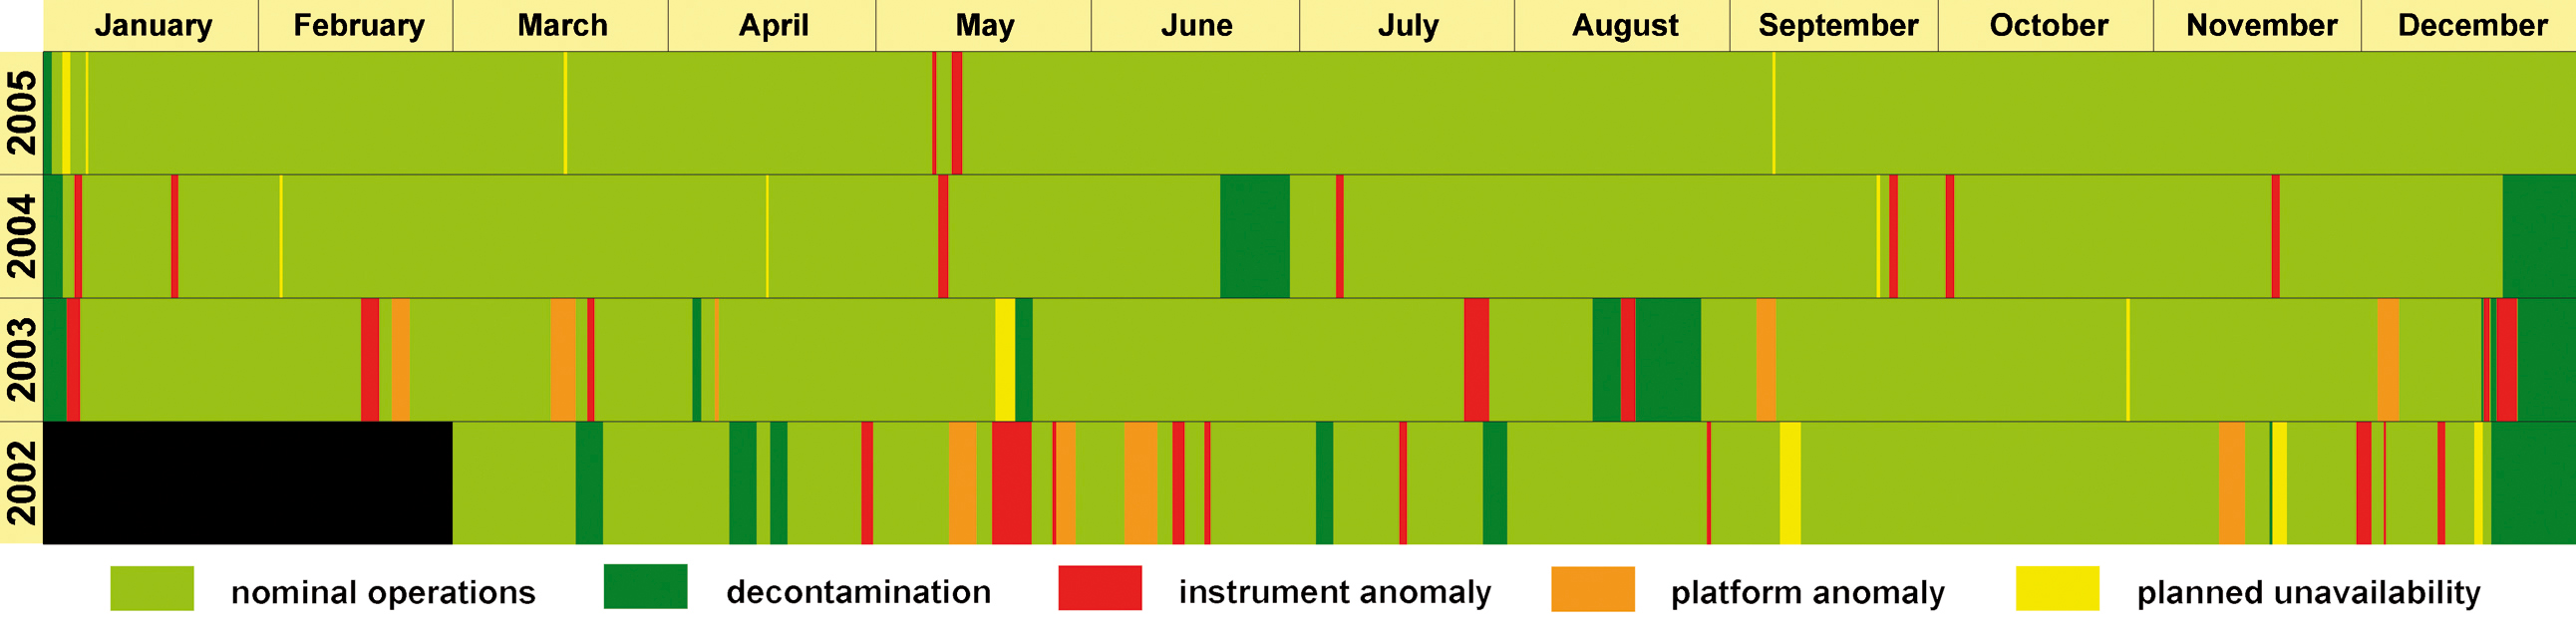
| Fig. 6-2 | Operations
summary for the commissioning and routine operations phase. Colour coding
indicates instrument availability. |
|
| Fig. 6-3 | Calibrated
SCIAMACHY solar irradiance spectrum measured April 18th, 2004, in comparison to the Kurucz solar reference spectrum. SCIAMACHY data
have been normalised to 1 AU sun distance. Kurucz data have been interpolated to the SCIAMACHY
wavelength grid. Top: SCIAMACHY (yellow) and Kurucz (blue) irradiance as function of
wavelength with the wavelength coverage of all 8 channels. Bottom: Relative deviation
between the two data sets. Small deviations in the wavelength calibration can cause large
fluctuations in the ratio of the spectra. Therefore, the deviation is shown as unsmoothed
(red) and smoothed (green) curve. The underlying grey bar shows the ±3% requirement for
the absolute radiometric calibration of SCIAMACHY which is fulfilled over almost the whole
spectral range. (graphics: IUP-IFE, University of Bremen) |

|
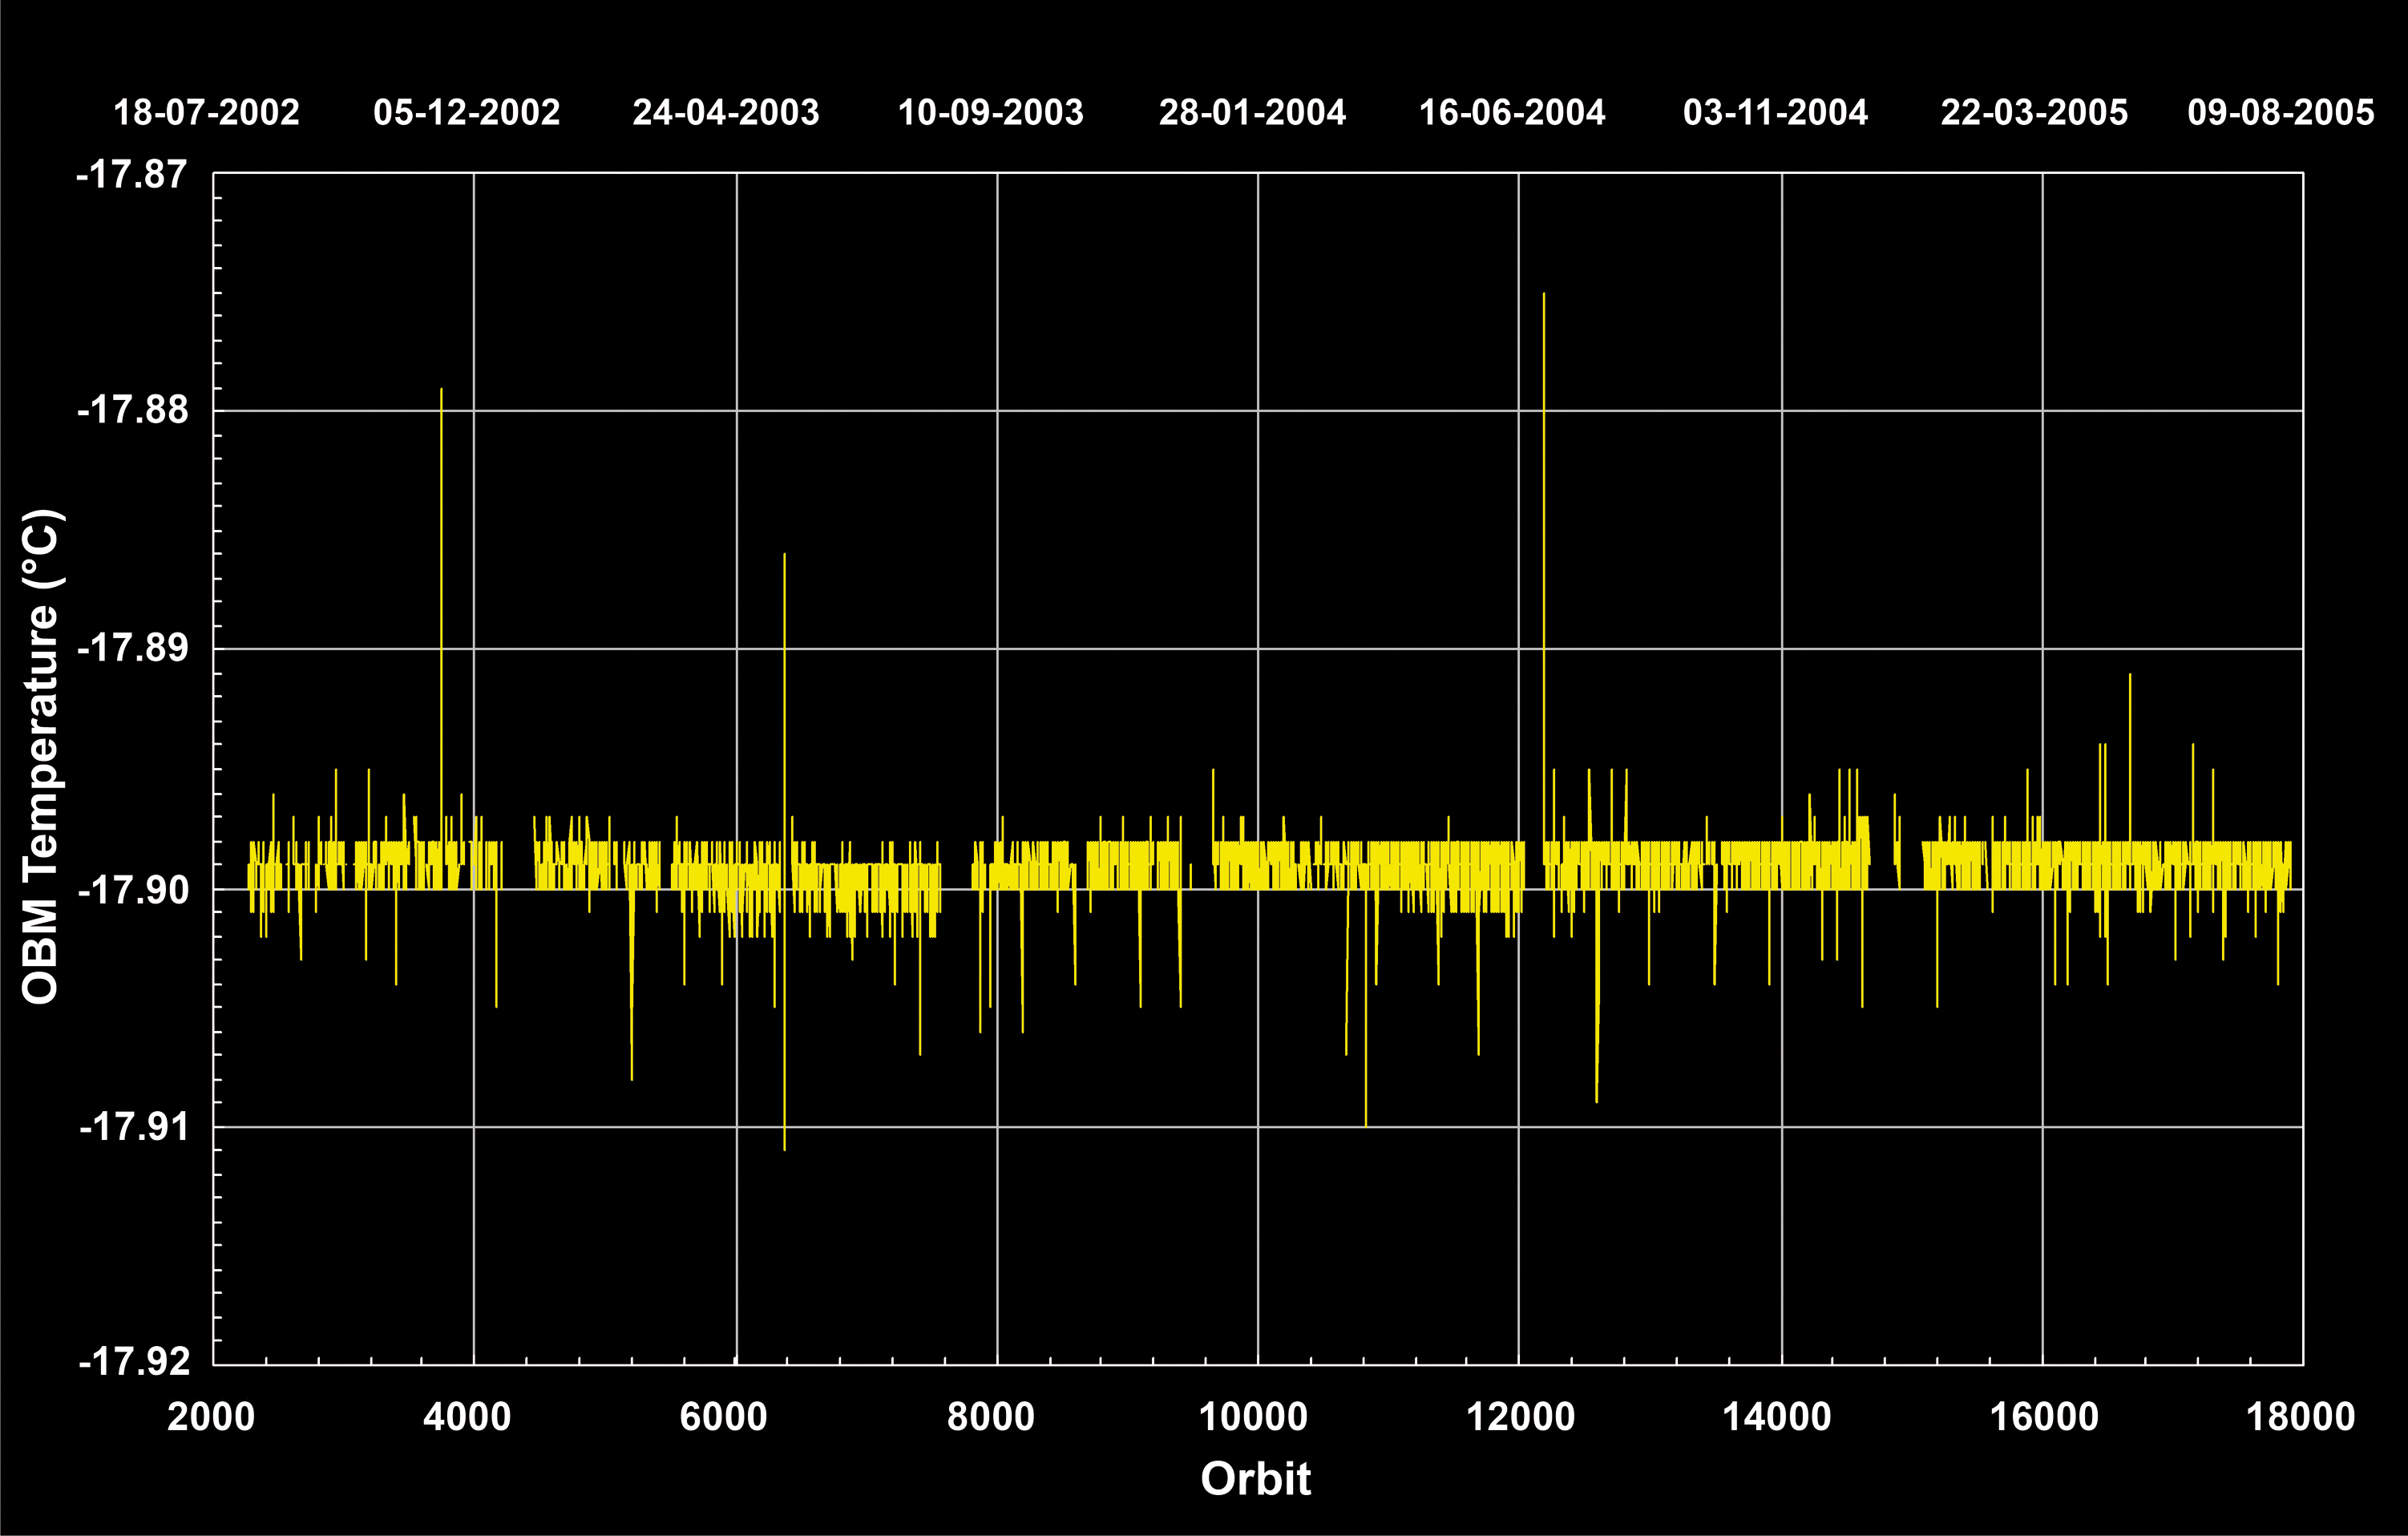
| Fig. 6-4 | Mean
OBM temperature per orbit between the start of quasi-routine measurements
in early August 2002 to August 2005, almost 3.5 years after launch. On orbit average, the ATC system
keeps the OBM within 0.001 °C of the selected temperature. (graphics: DLRIMF) |
|
| Fig. 6-5 | Power
consumption of the 3 heaters (Nadir, Limb and RAD_A) of the ATC system. The
curve follows a seasonal variation with an expected long-term decrease most prominent for
the ATC_Nadir heater. (graphics: DLR-IMF) |

|
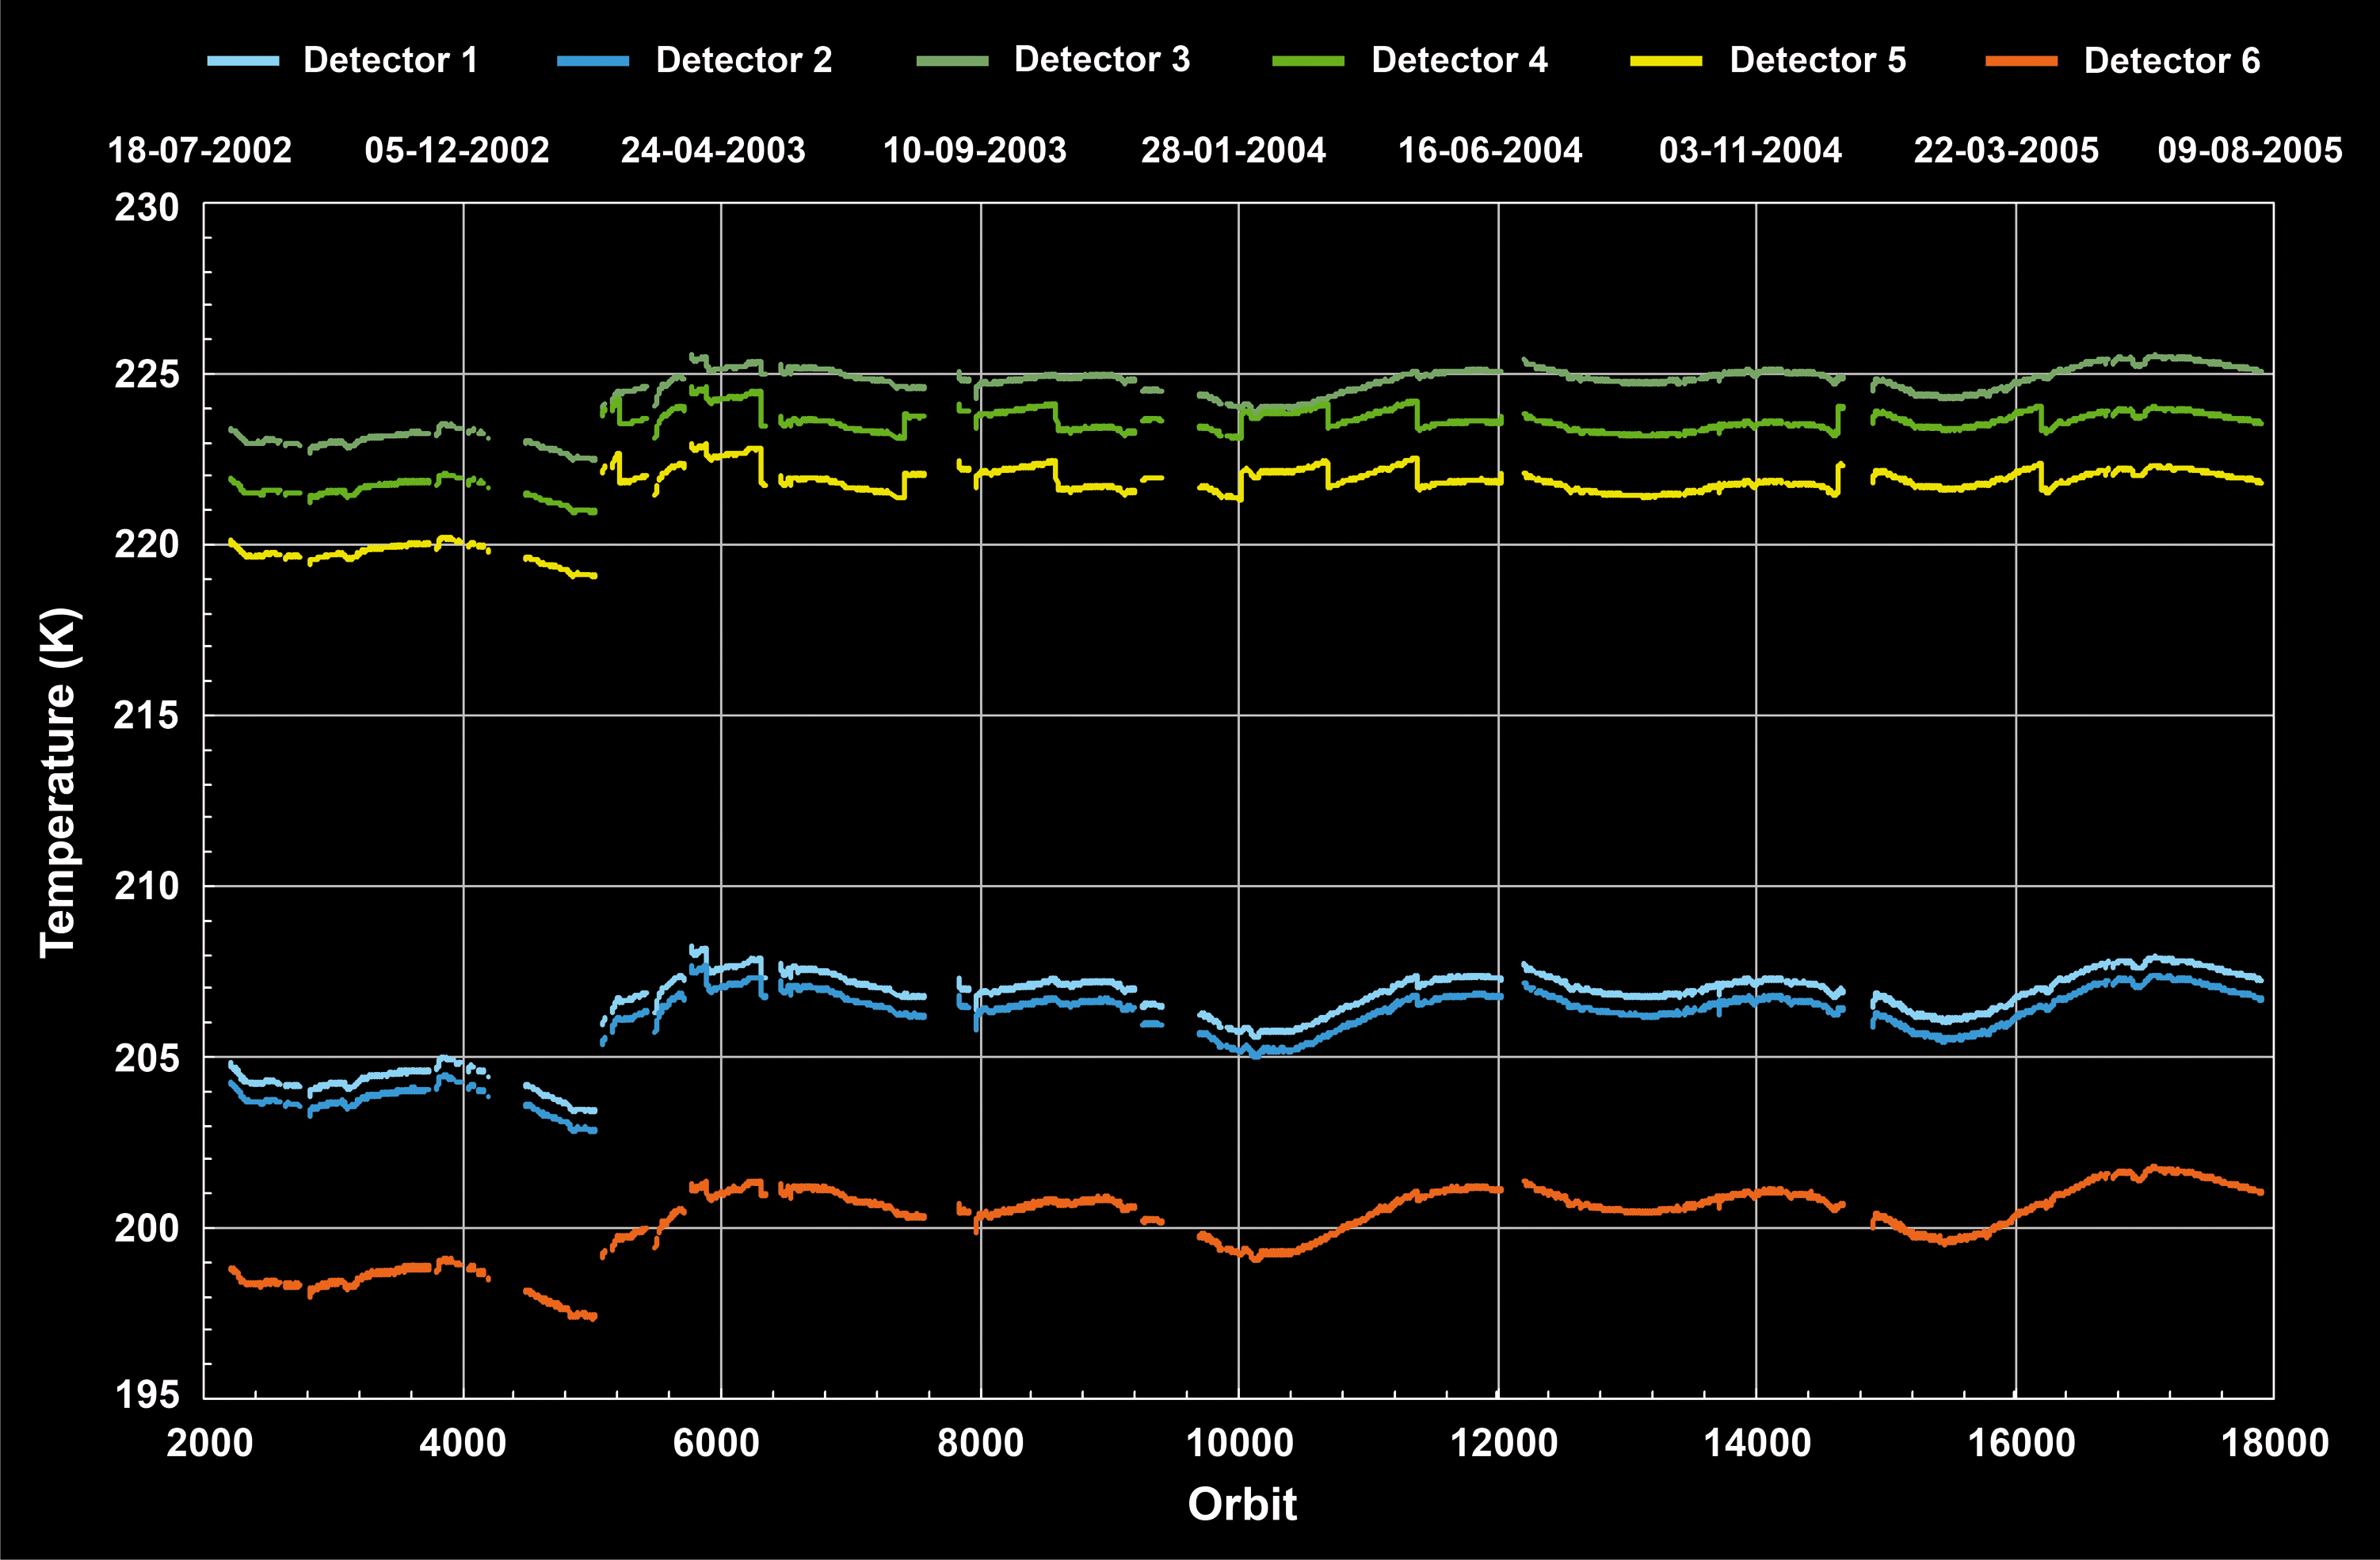
| Fig. 6-6 | Mean
detector temperatures per orbit for channels 1-6. Decontamination intervals
with elevated temperatures and periods after instrument safing with too low temperatures are
omitted. The resulting curves display the seasonal variation. Steps are due to TC adjustments,
mainly affecting channels 4 & 5. The increase around orbit 5000 corresponds to an
overall TC correction to establish new temperature ranges. (graphics: DLR-IMF) |
 |
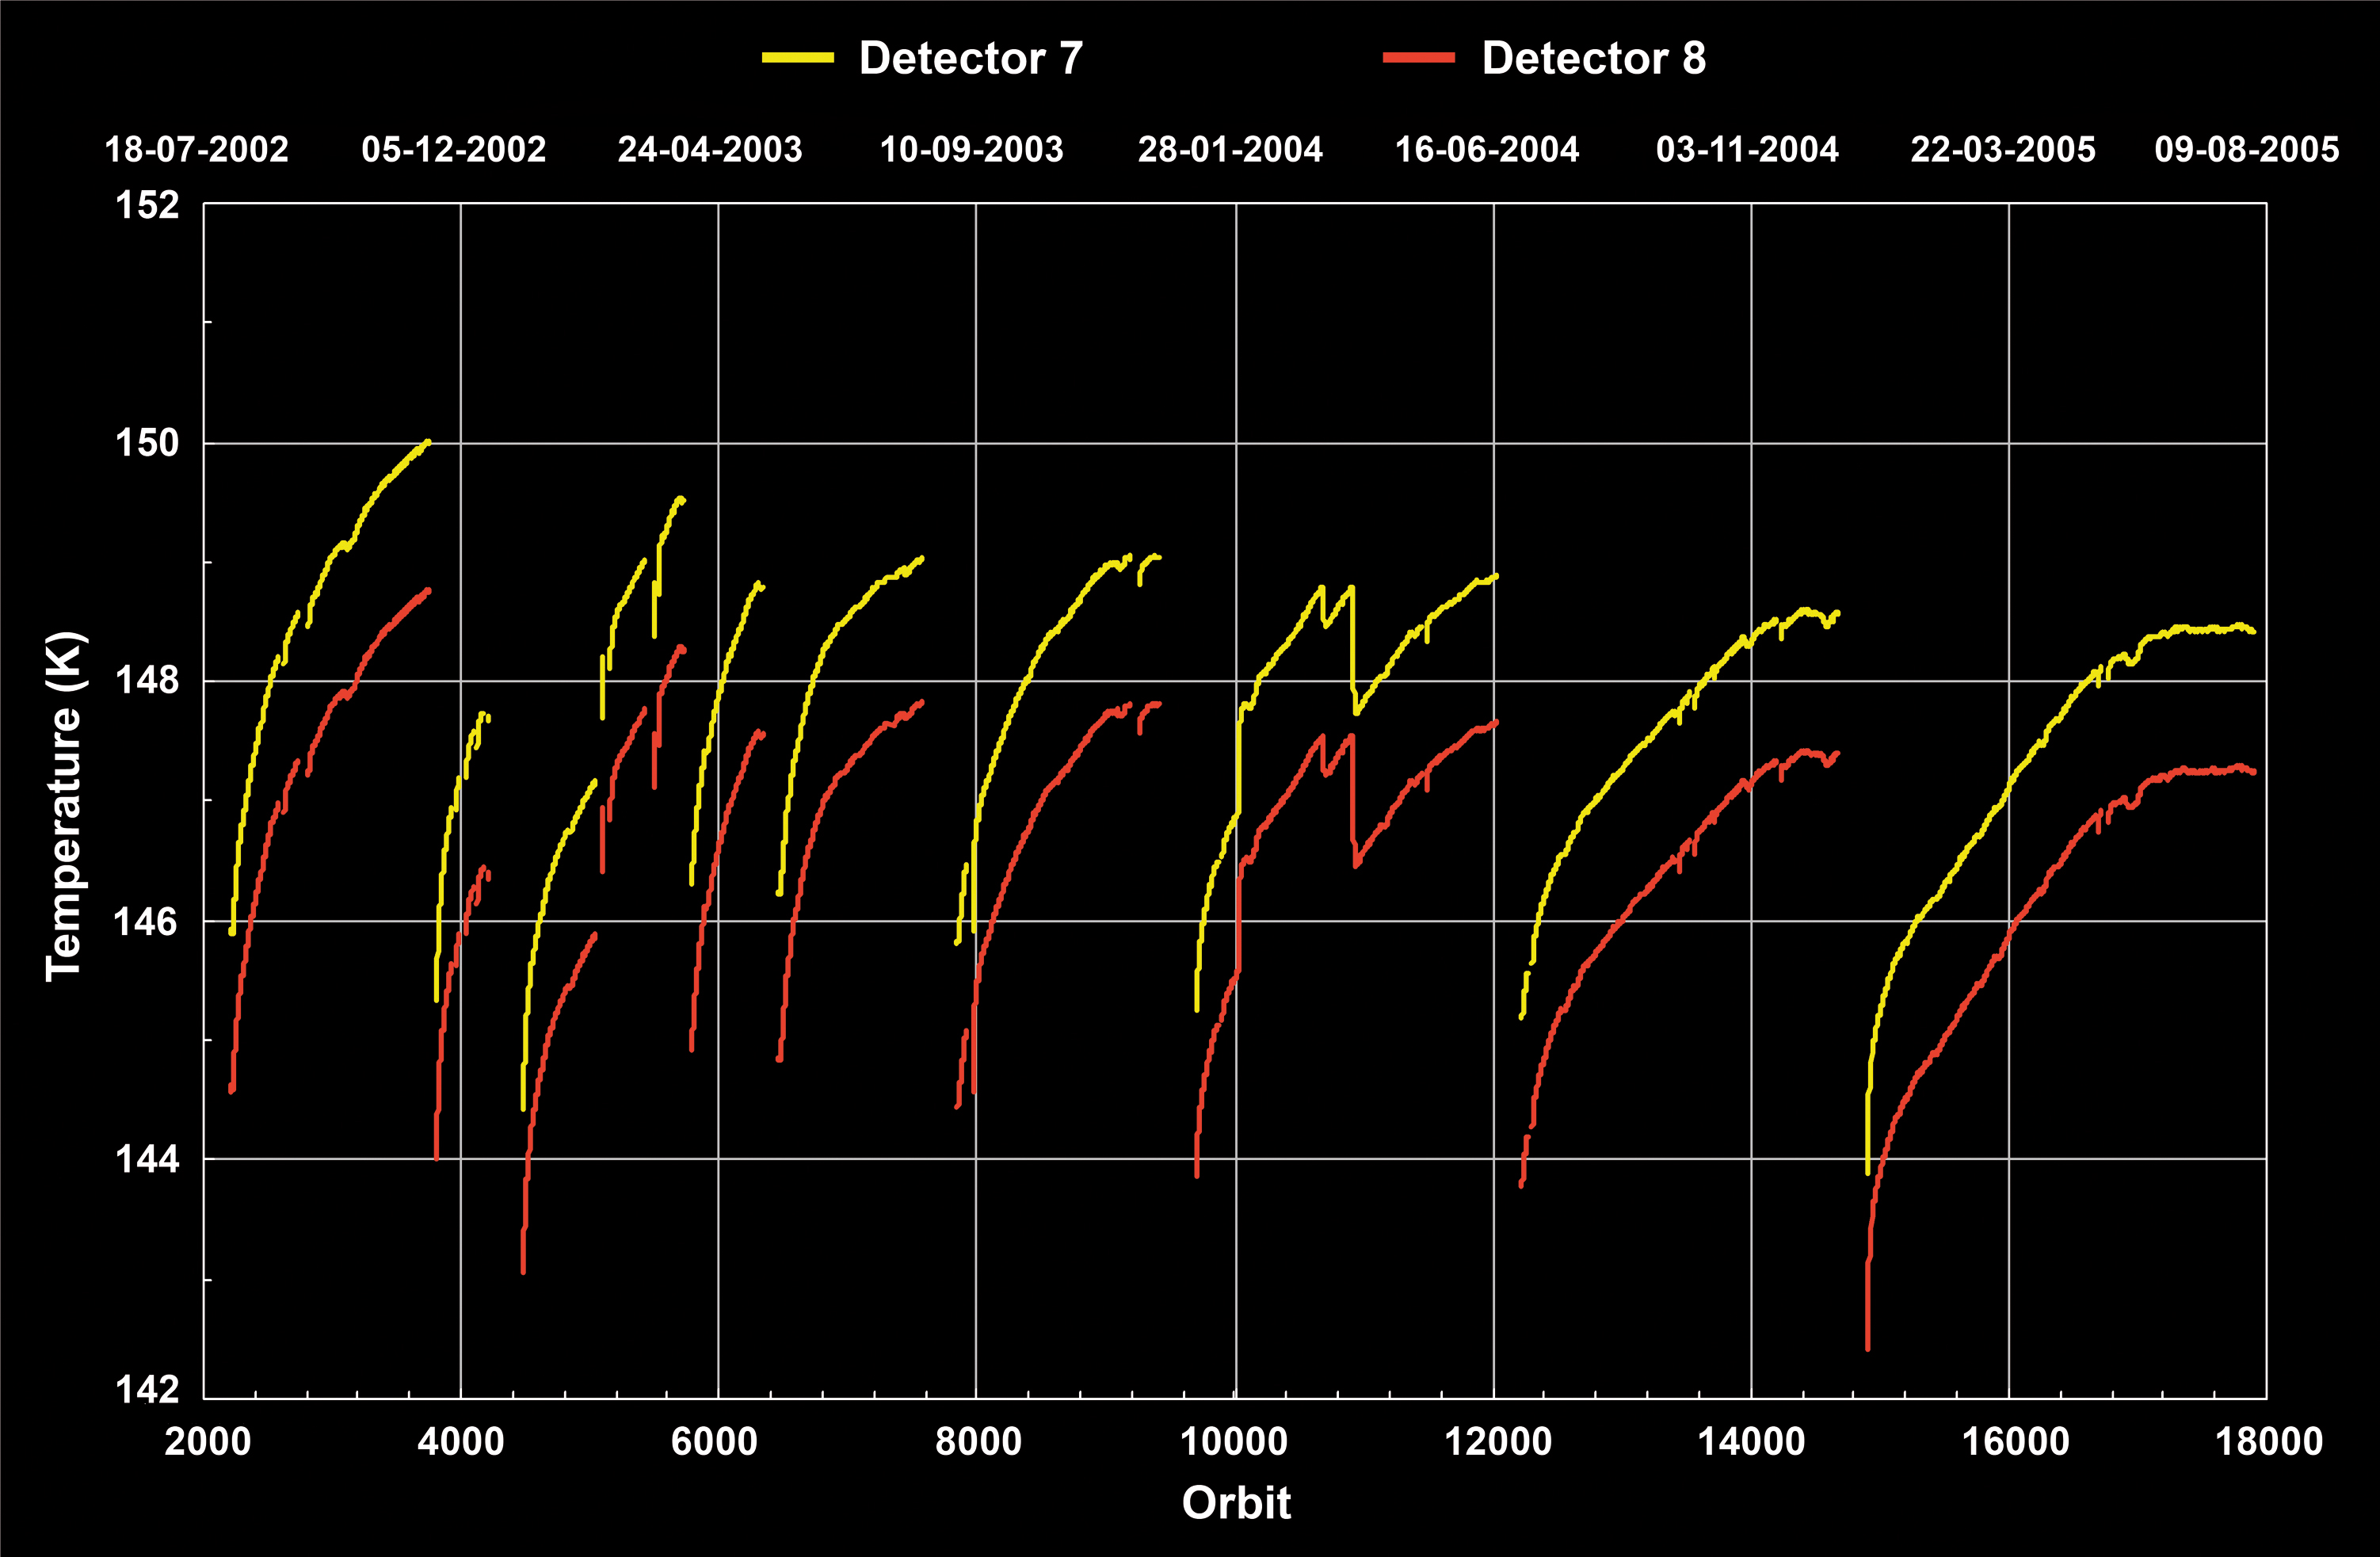
| Fig. 6-7 | Mean
detector temperatures per orbit for the SWIR channels 7 & 8. Displayed data are as
in fig. 6-6. The graphs are the result of growing ice (increase) and occasional decontaminations
(drop to lower values). Between orbit 10600 and 10900 two TC adjustments had a significant
impact on the SWIR detectors. (graphics: DLR-IMF) |
|
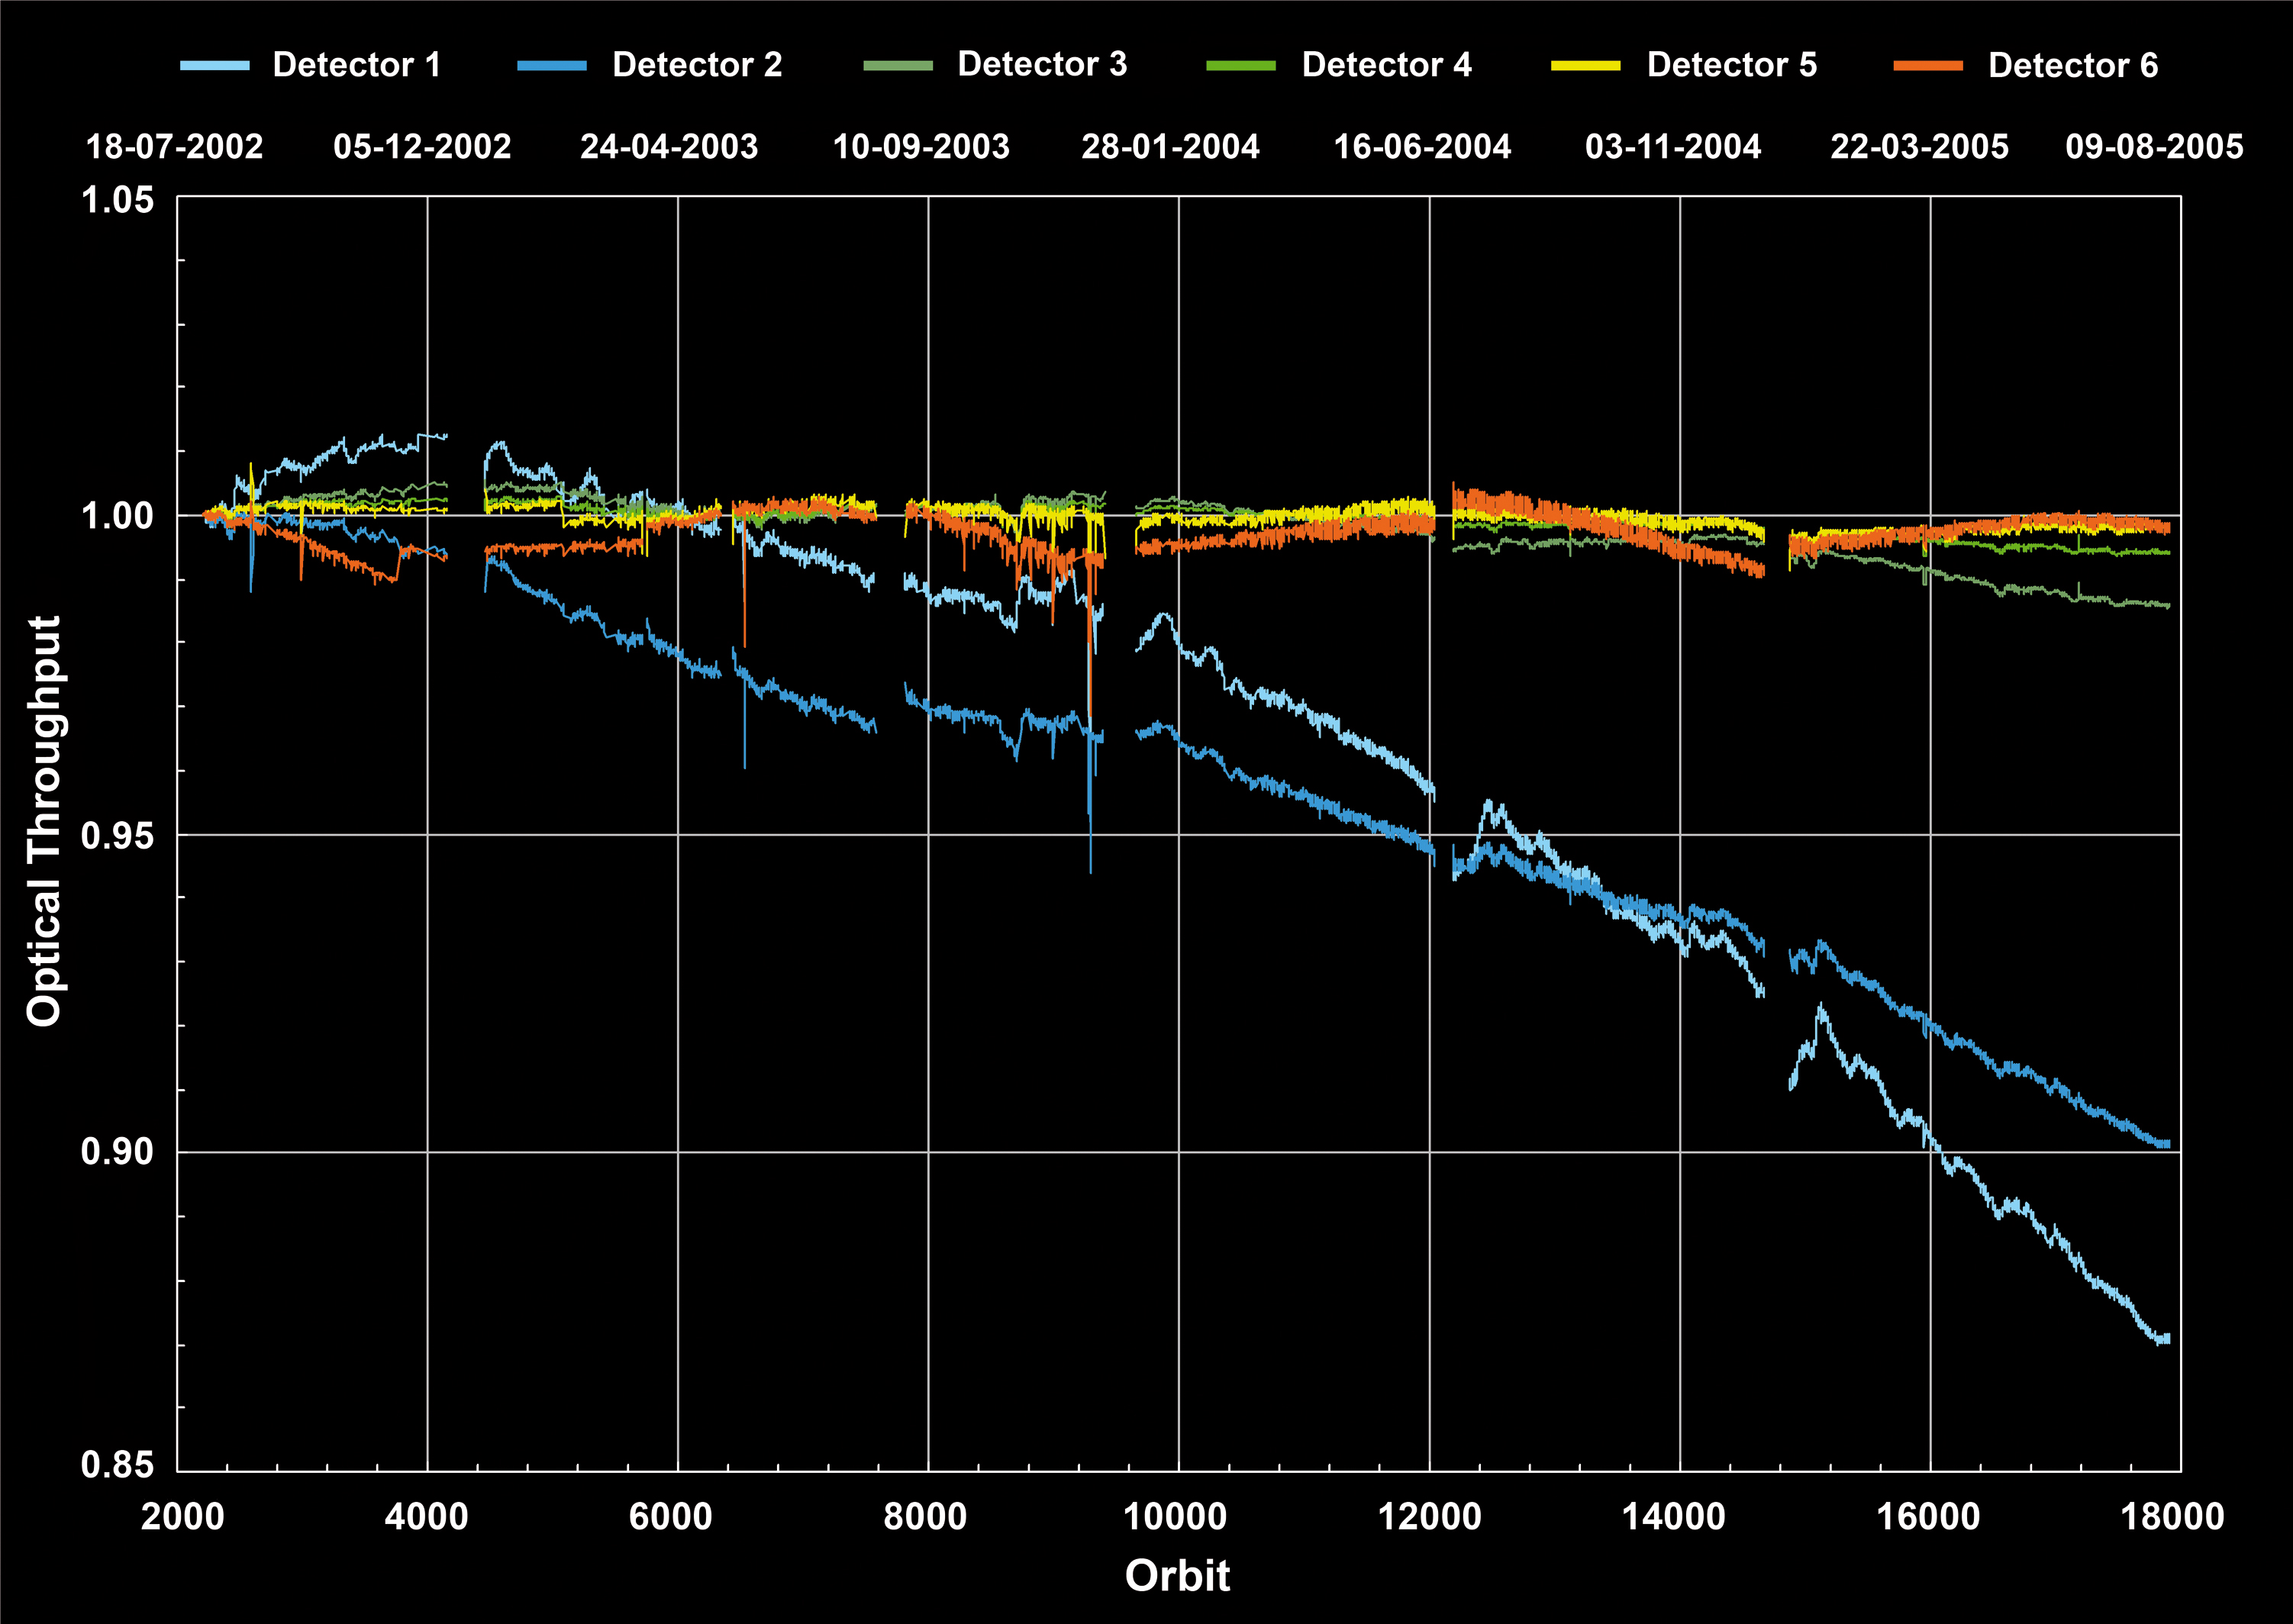
| Fig. 6-8 | Optical
throughput for channels 1-6. As in fig.6-6, decontamination intervals and
periods after instrument safing are omitted. The information has been derived from the operational
light path monitoring using the sun via the ASM and ESM mirror. (graphics: DLRIMF
and IUP-IFE, University of Bremen) |
|
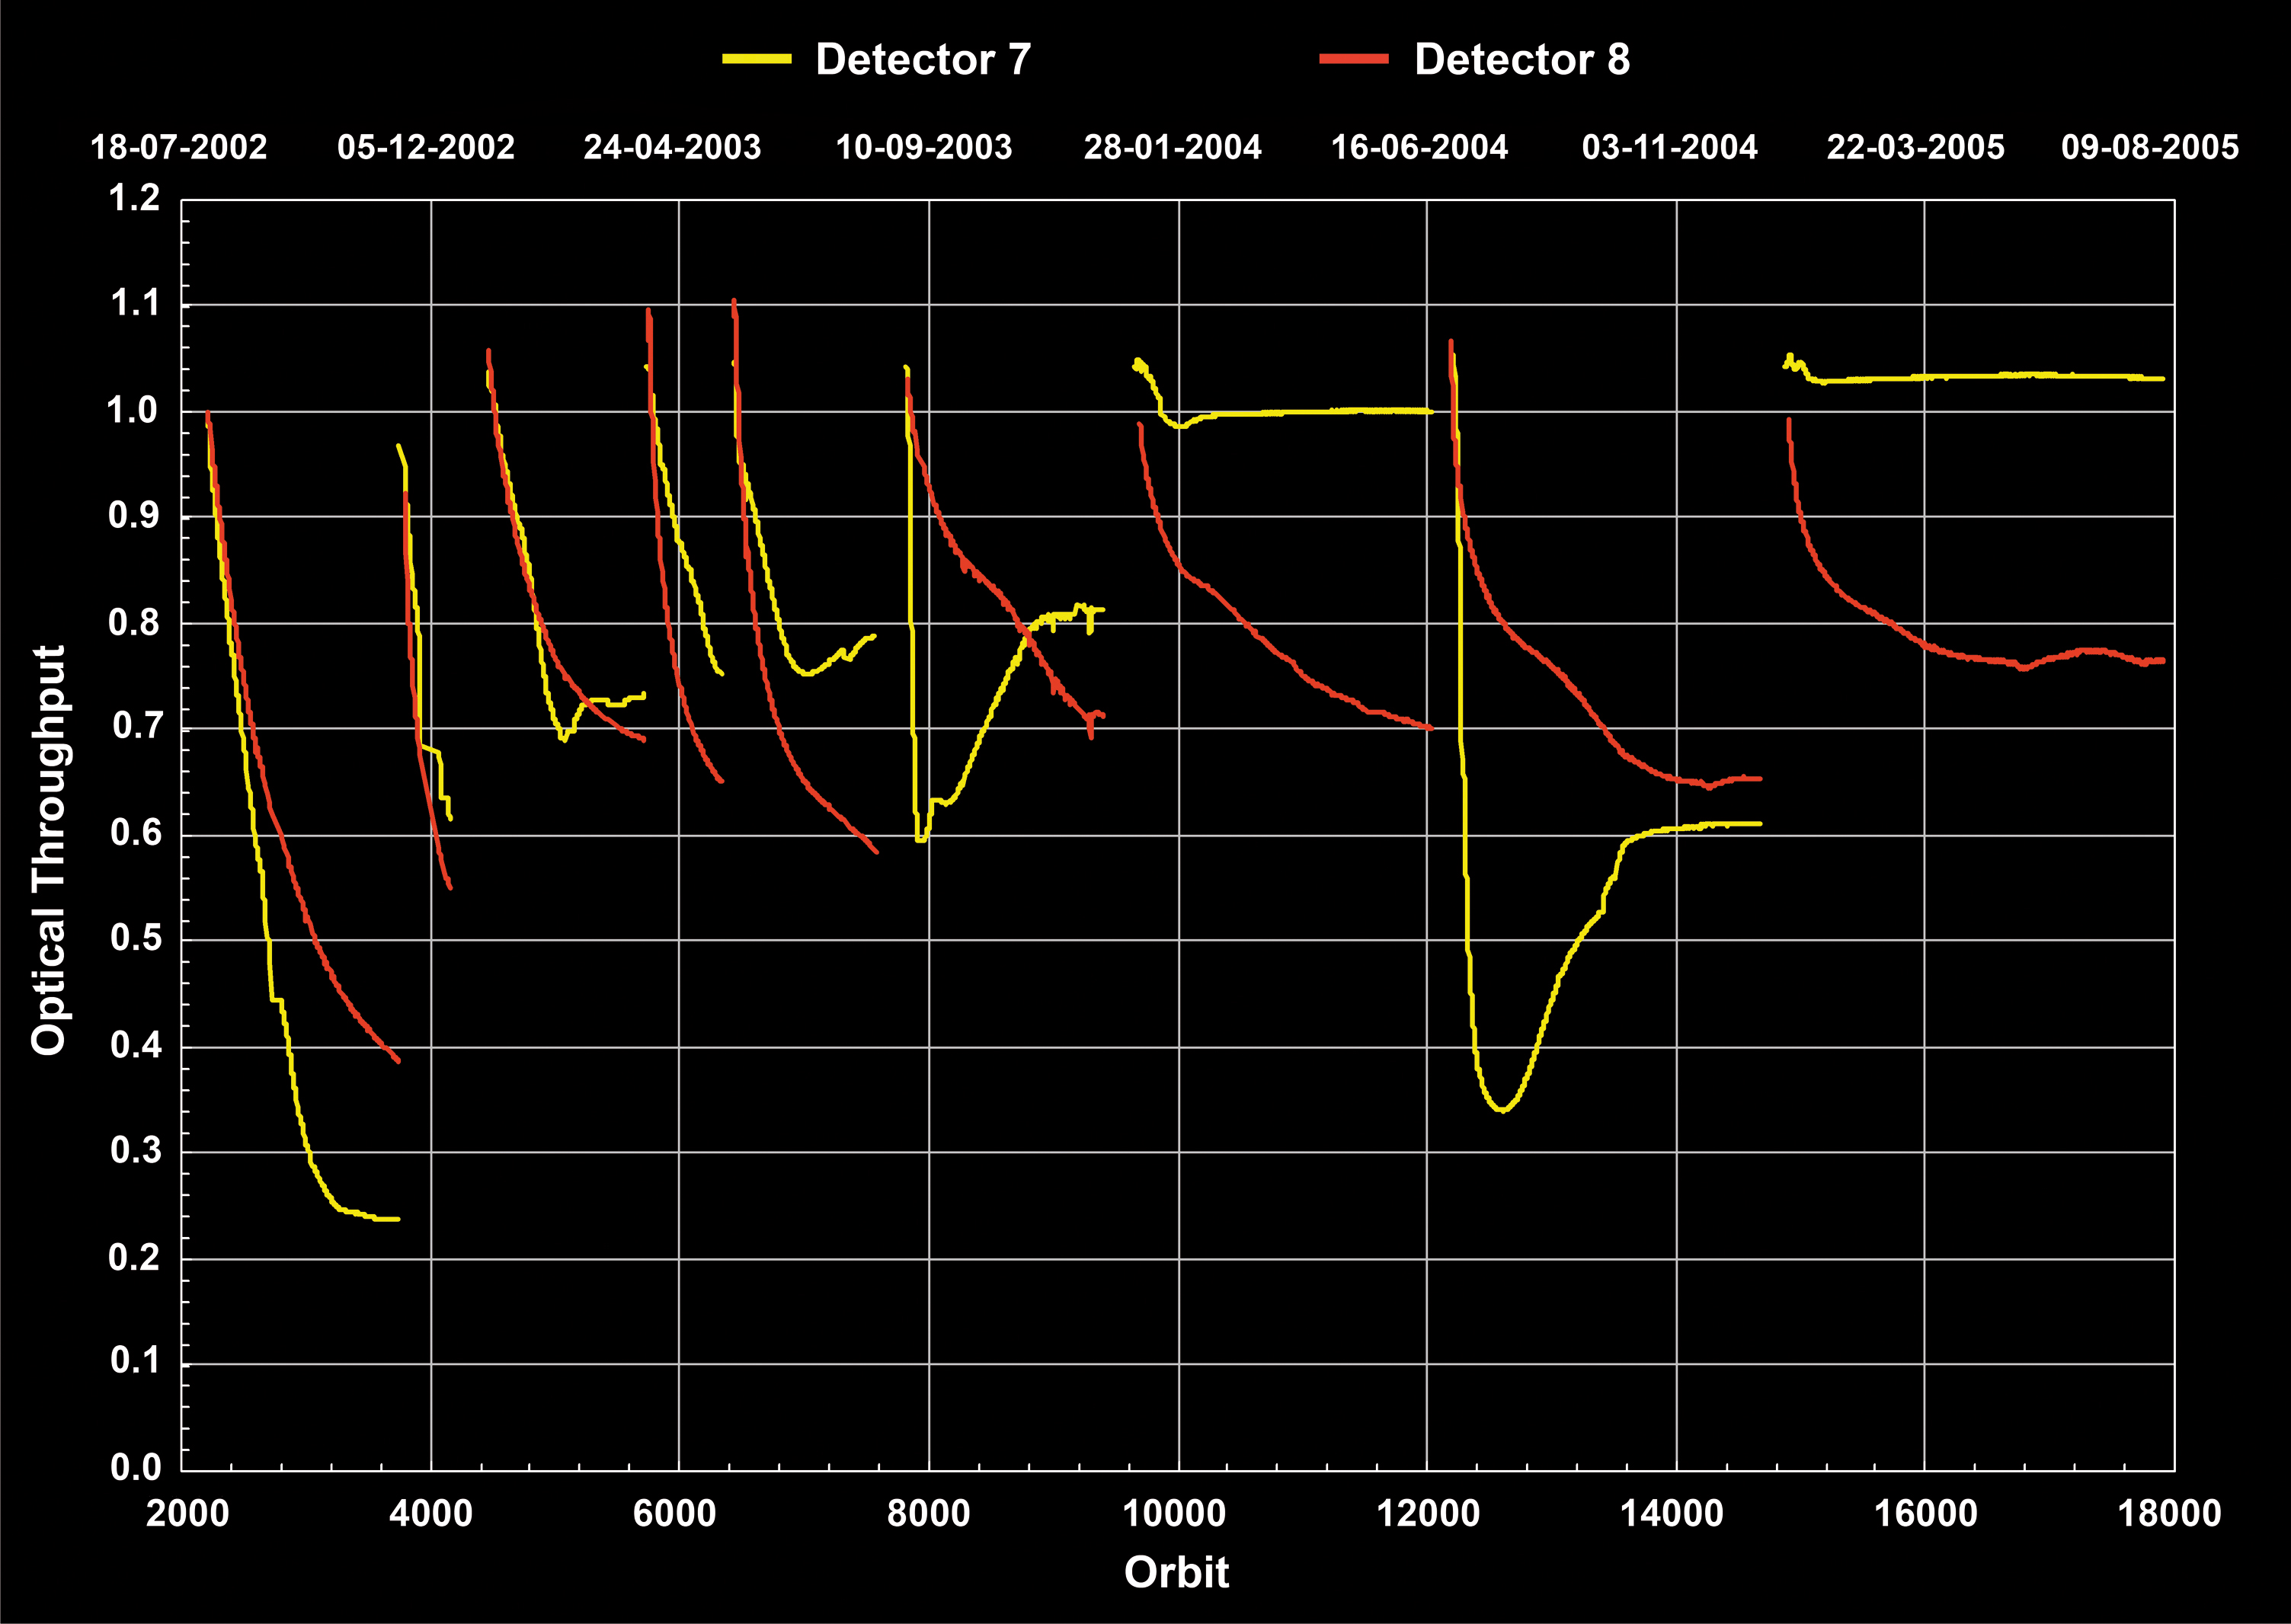
| Fig. 6-9 | Optical
throughput for the SWIR channels 7 & 8. Similarly to fig. 6-7, a growing ice
layer and its decontamination induced evaporation determines the shape of the curve. (graphics:
DLR-IMF and IUP-IFE, University of Bremen) |
|
| Fig. 6-10 | LLI
status after more than 3 years of operations. The expected End-of-Life (EOL) values
for the specified mission lifetime are all below 100%. In case of a mission extension, as
currently discussed, the EOL values will either be higher or the mission scenarios have to be
adapted accordingly. (graphics: DLR-IMF) |

|
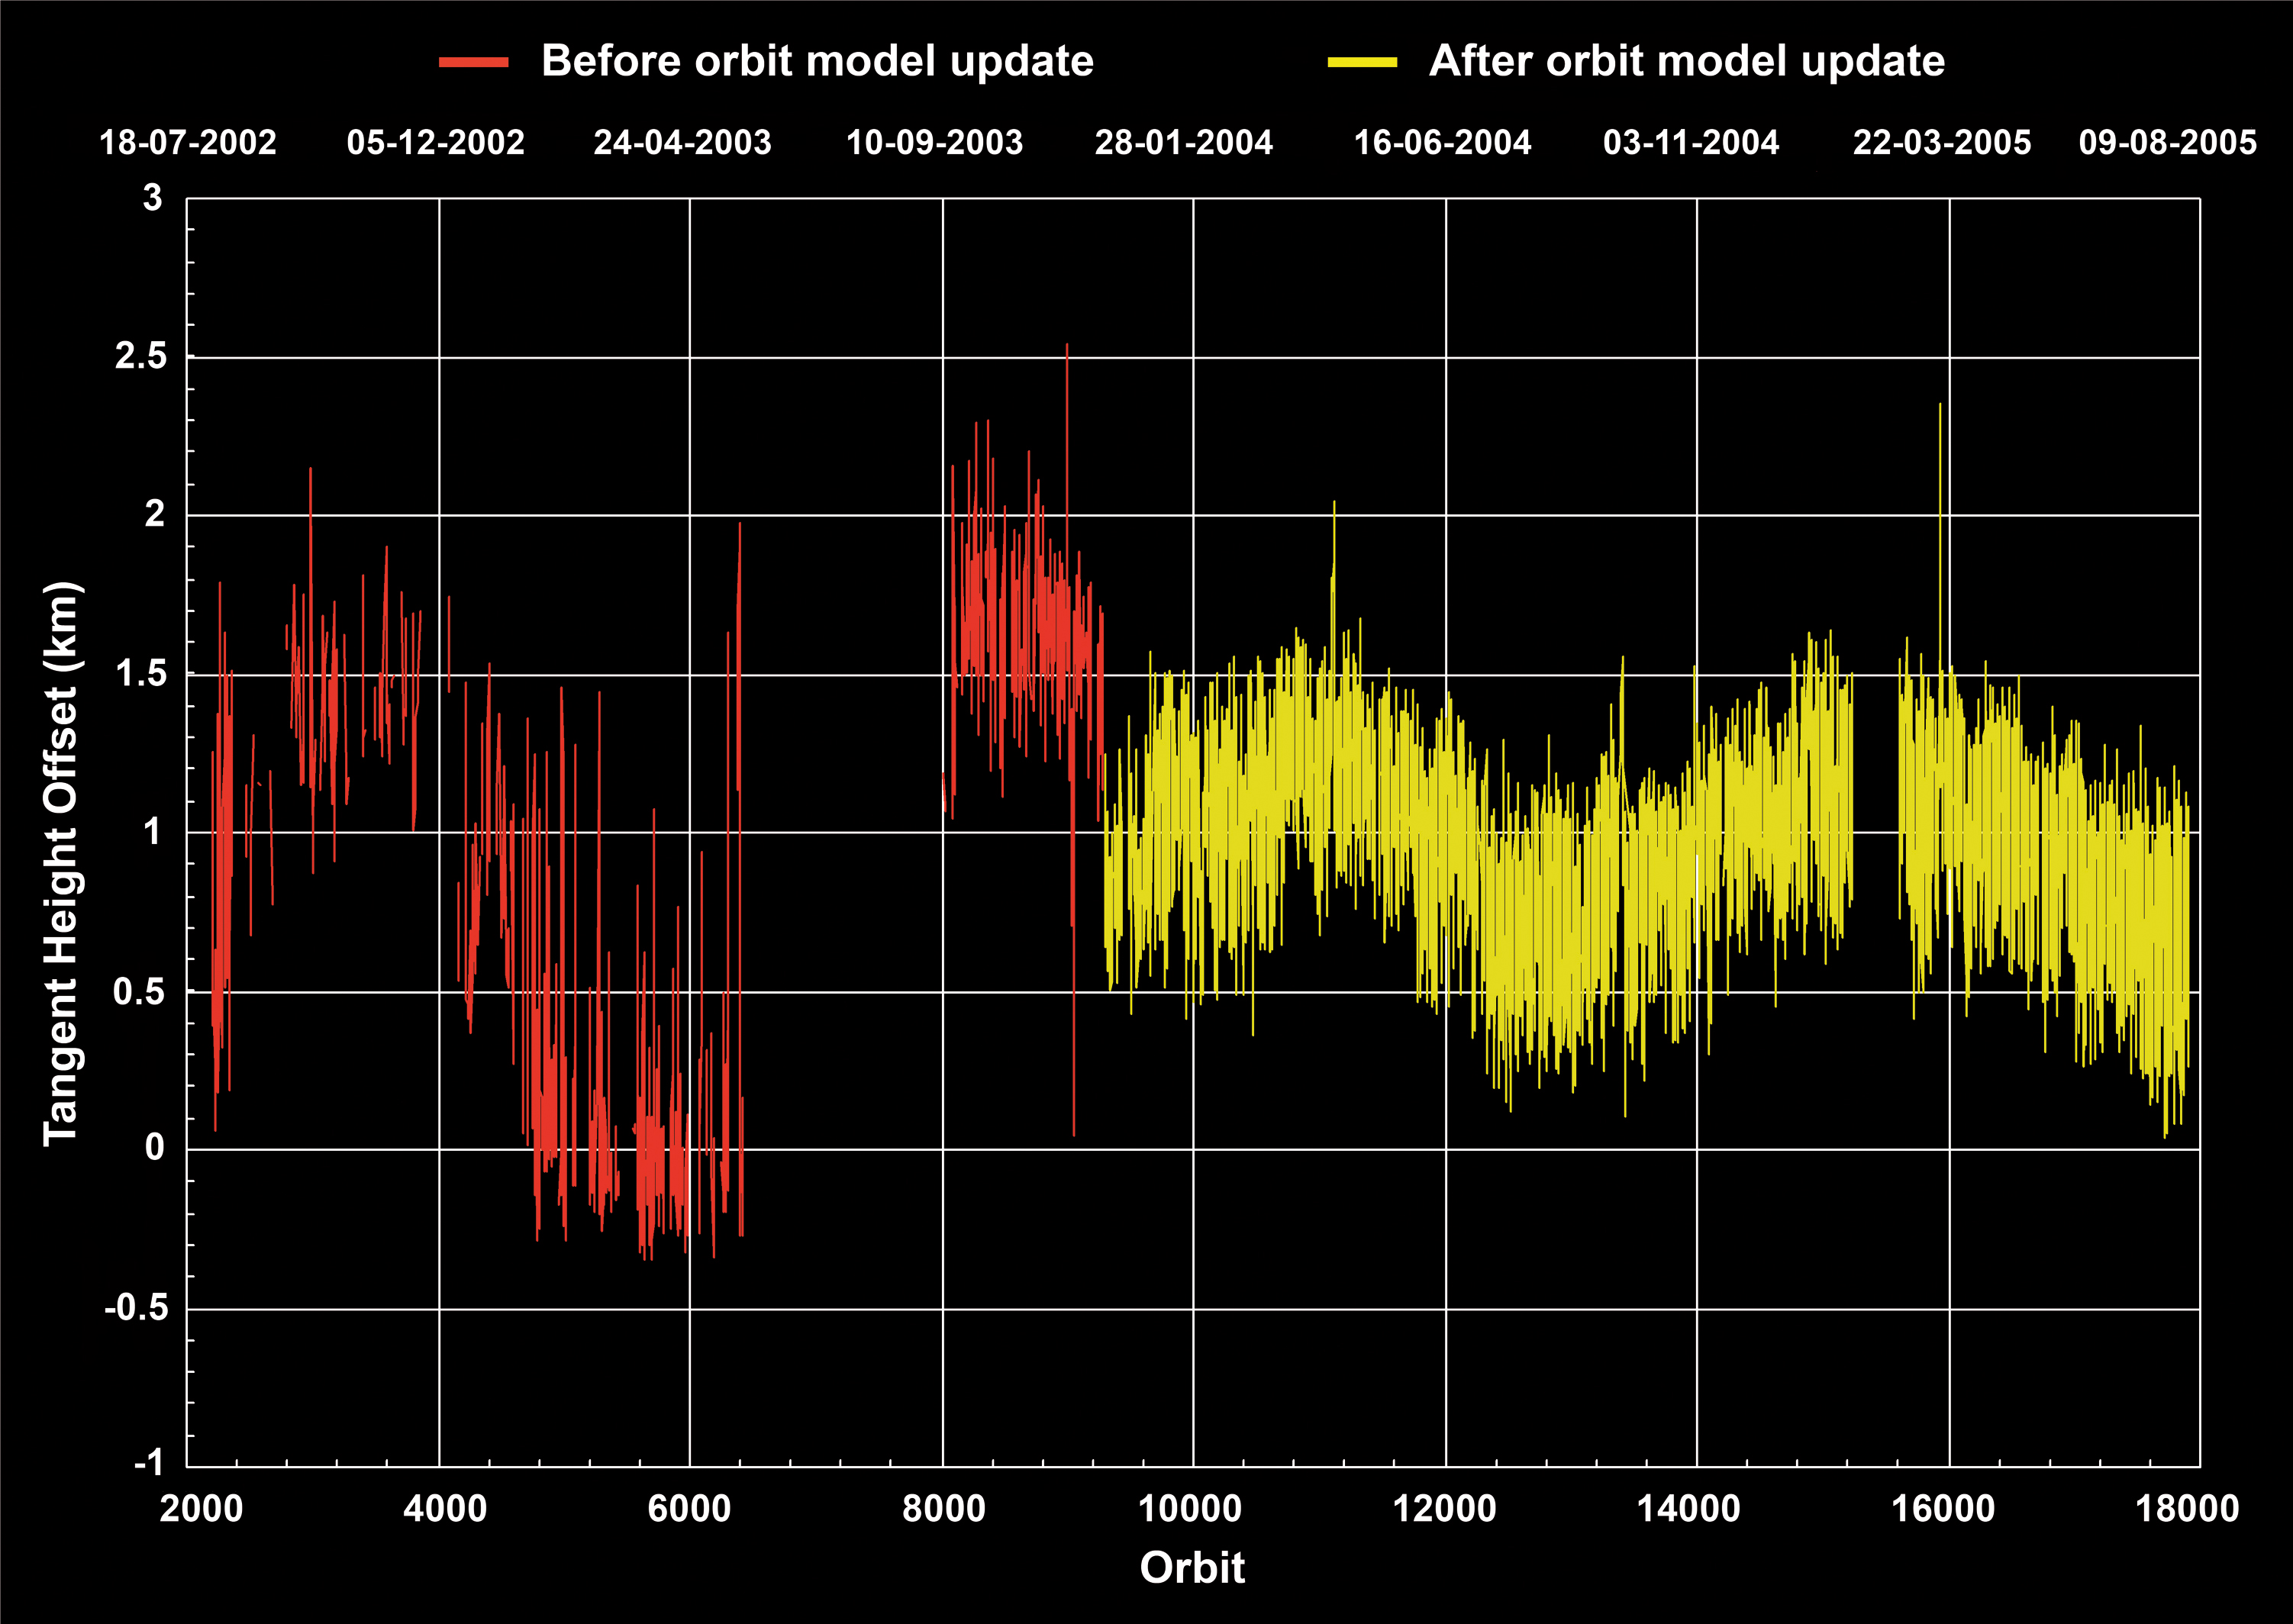
| Fig. 6-11 | Tangent
height offsets as determined from operational data products and TRUE retrieved
profile information. Prior to December 2003 the bias had a strong harmonic variation.
After the update of the on-board propagator model this variation is reduced but a constant offset
persists. (graphics: DLR-IMF and IUP-IFE, University of Bremen) |
|
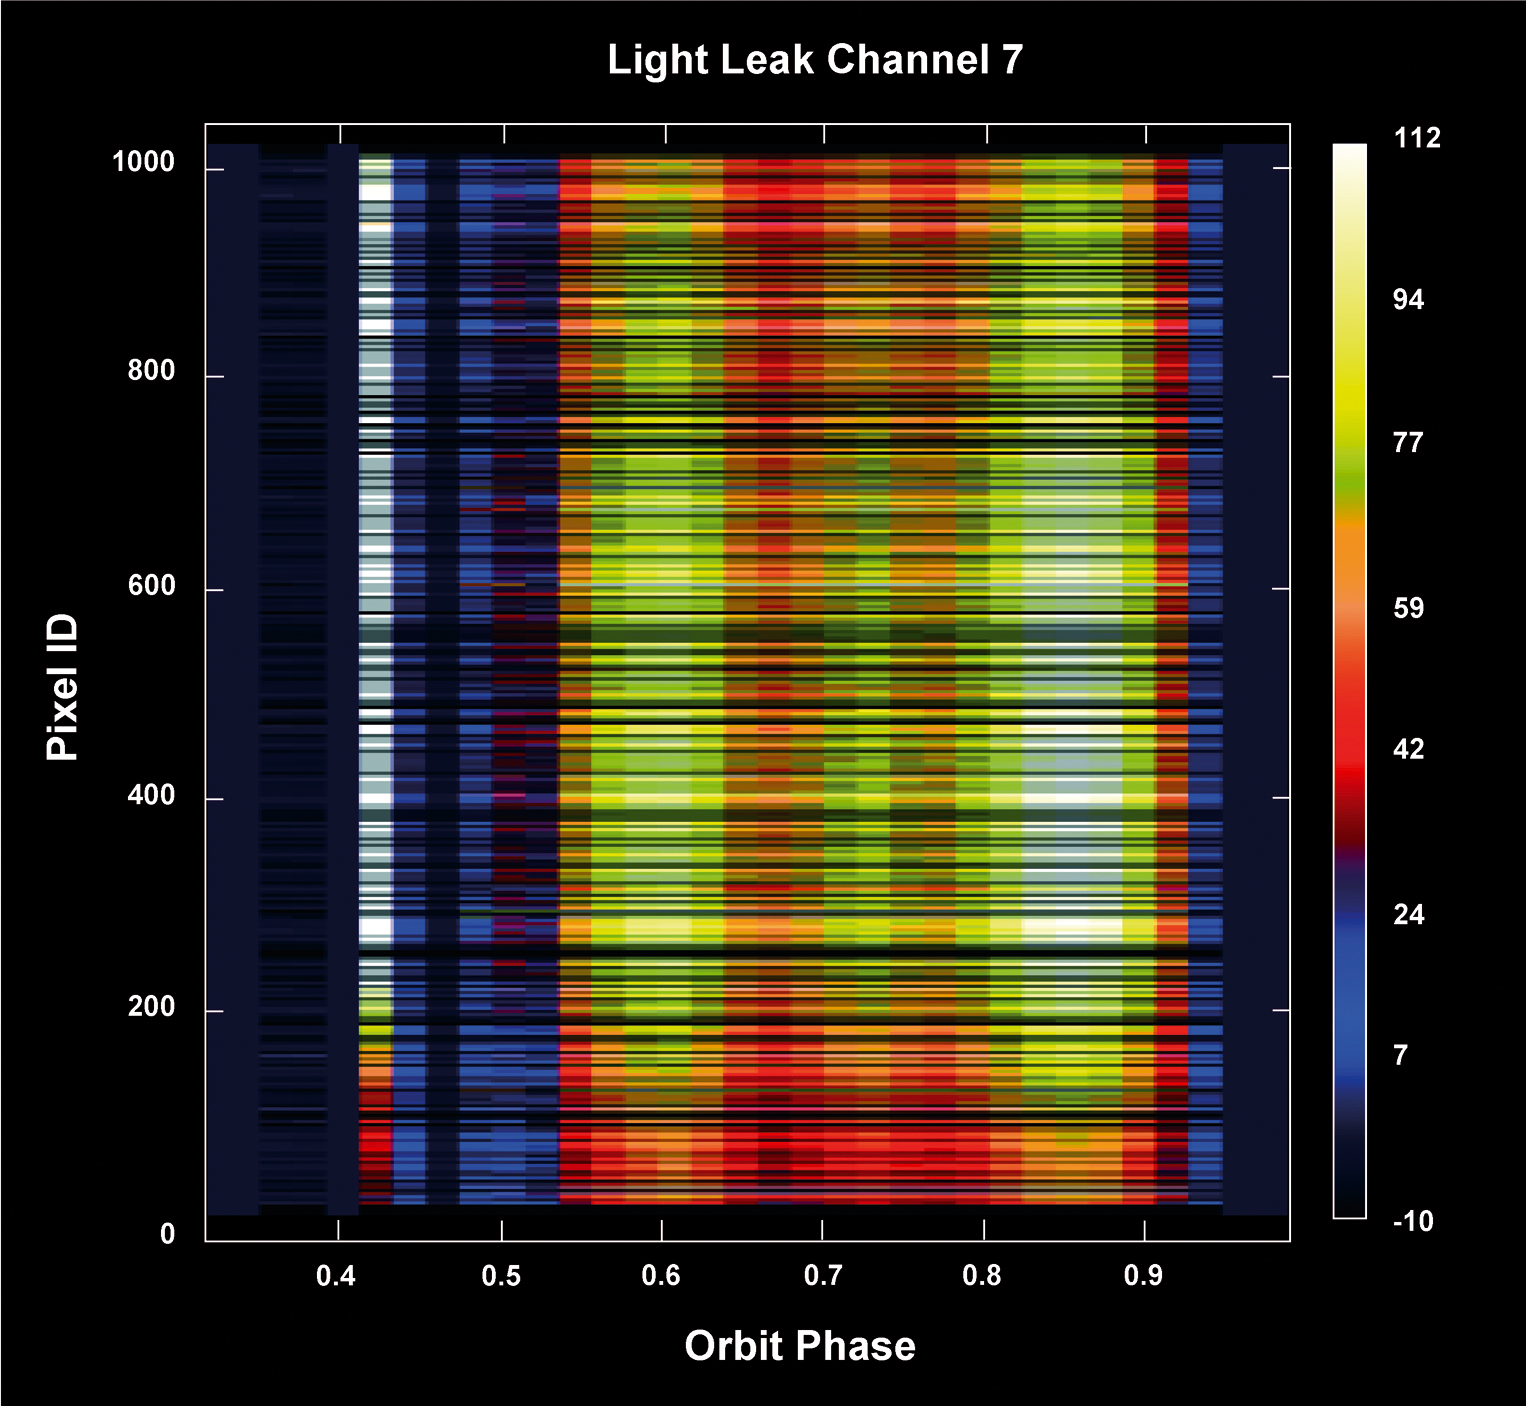
| Fig. 6-12 | Mean
light leak signal for all pixels in channel 7 as a function of orbit phase. The x-axis shows the orbit phase (eclipse corresponds
to phase 0.95-0.40, sunrise occurs at phase 0.41), the y-axis the pixel number in channel 7. The colours indicate the size of the light leak
signal in BU/sec. (graphics: DLR-IMF and SRON) |
 |
Page generated 26 March 2007